What’s it for?
Provides a real-time view of ACM at a glance, and significantly reduces time to repair by pin-pointing the underlying cause of issues. Covers:
- Server hardware and OS health
- Processor occupancy and uptime
- Media Gateway registration
- Gatekeeper health
- Alarms attributable to Media Gateways
- Carrier local loop health for DS1
VSM dashboards run the same diagnostic commands experienced engineers run when they are identifying problems. These commands are run on a minute to minute basis, and the results are displayed on a dashboard, color-coded to reflect solution health.
Where do I find it?
Dashboards are available in VSM’s Service Desk module within Dashboard Management. Service Desk contains a growing number of user-configurable dashboards that display health across your entire UC and CC platform.
ACM Dashboard in Action
Watch a demonstration of the ACM dashboard.

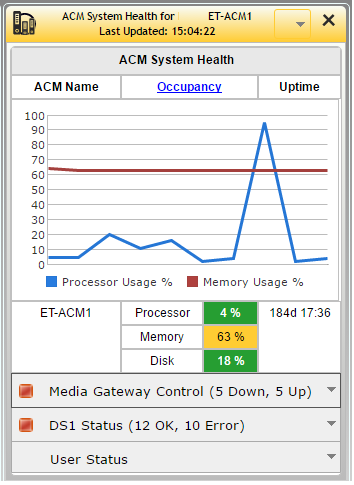
This customer has issues that need attention, highlighted by the traffic light color coding:
- The processor at the customer is regularly spiking above the 70% occupancy recommended by the manufacturer.
- Memory is starting to run low.
- An issue has caused half of the media gateways to deregister.
- 10 of the 22 DS1’s show errors between the DS1 and the telecommunications carrier
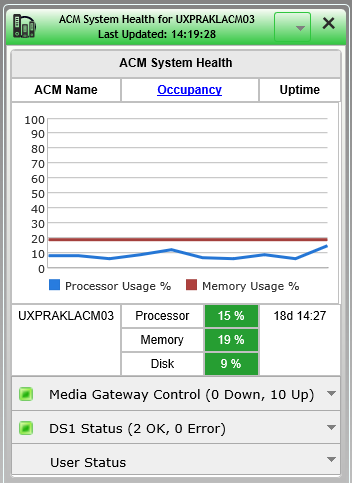
This customer is running nicely:
- The processor and memory are running within recommendations
- All Media Gateways are registered and have no alarms
- The DS1 telecommunications carrier-side is operating error free