What’s it for?
Provides a real time view of AES at a glance, and significantly reduces time to repair by pin-pointing the underlying cause of issues.
VSM dashboards run the same diagnostic commands experienced engineers run when they are identifying problems. These commands are run on a minute to minute basis, and the results are displayed on a dashboard, colour-coded to reflect solution health.
AES Dashboard covers:
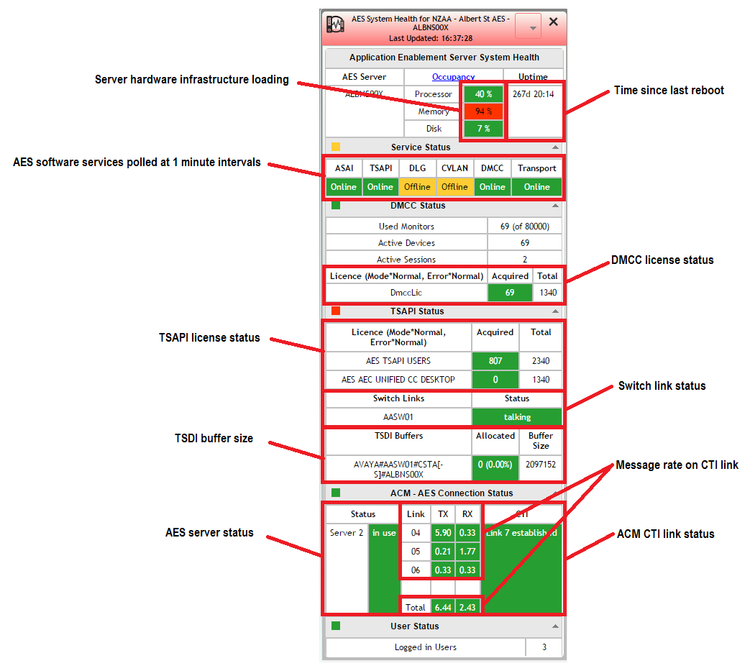
- · Server hardware and OS health
- · Processor occupancy and uptime
- · State of Software Services
- · Purchased and Acquired DMCC Licenses
- · Purchased and Acquired TSAPI Licenses
- · TSDI Buffer status
- · Switch link status
- · Message rate on the CTI link to ACM
Where do I find it?
Dashboards are available in VSM’s Service Desk module. Service Desk contains a growing number of user-configurable dashboards that display health across your entire UC and CC platform.
AES Dashboard in Action
Click on the screen below for a demonstration.
AES Dashboard Example