What’s it for?
Provides a real time view of Avaya CMS system health at a glance, and significantly reduces time to repair by pin-pointing the underlying cause of issues. Covers:
- Server hardware and OS health
- Processor occupancy and uptime
- Backup status
- Connection to ACM status
- Number of CMS Supervisor clients connected
VSM dashboards run the same diagnostic commands experienced engineers run when they are identifying problems. These commands are run on a minute to minute basis and the results displayed on a dashboard, color-coded to reflect solution health.
Where do I find it?
Dashboards are available in VSM’s Service Desk module within Dashboard Management. Service Desk contains a growing number of user-configurable dashboards that display health across your entire UC and CC platform.
CMS Dashboard in Action
Click on the screen below for a demonstration.
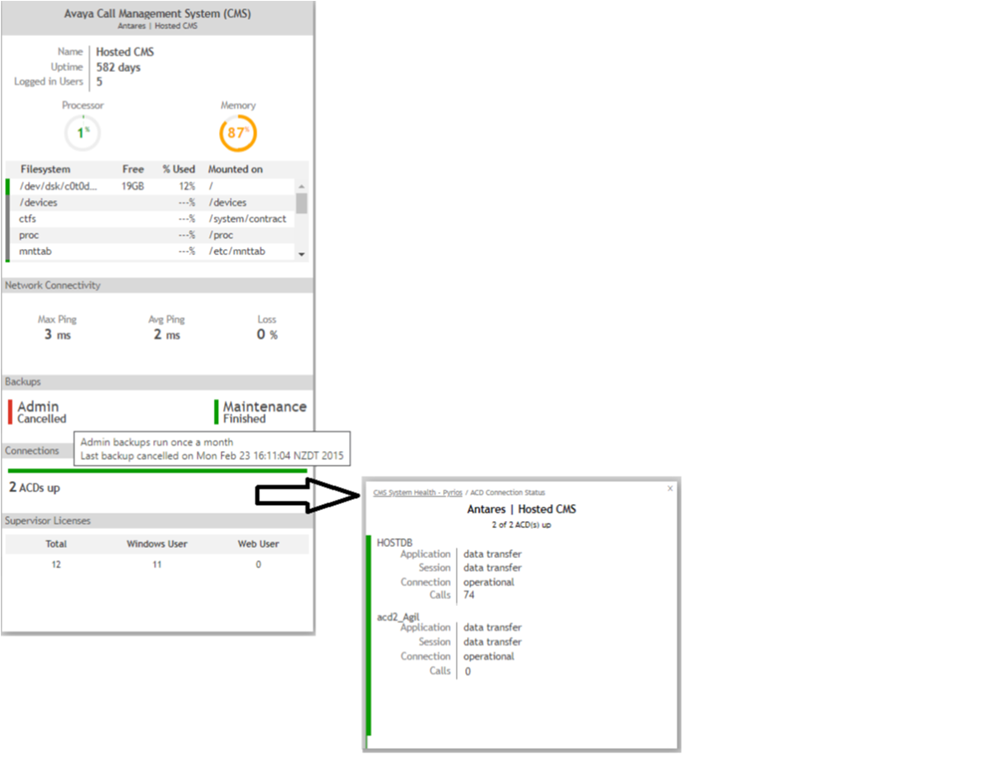
CMS Dashboard Example 1

This customer has issues that need attention, highlighted by the traffic light color coding:
- The memory consumption is a little high and should be observed for a potential memory leak
- The administration backup has been cancelled, with mouseover giving addition detail. This could be an issue if this server needs to be rebuilt from scratch
- 2 ACD connections are running and are operational at all layers with 74 call records being dealt with on HostDB
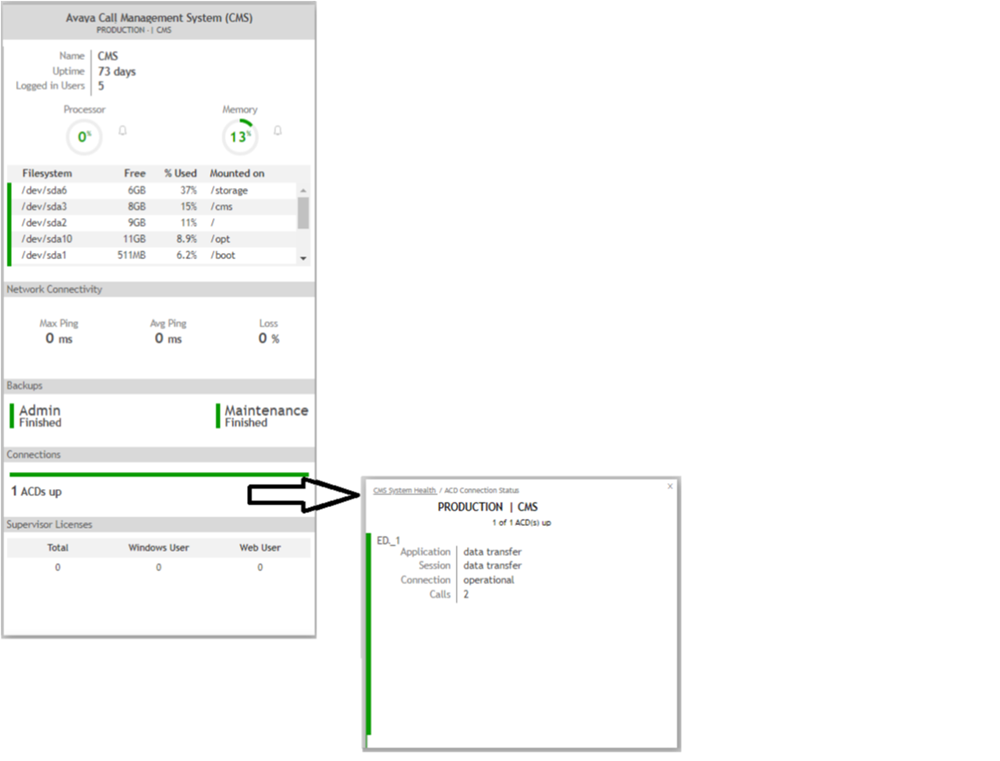
CMS Dashboard Example 2

This customer is running satisfactorily:
- The processor and memory are running within recommendations. Note the thresholds set on Processor and Memory to provide warnings
- The connection to ACM is running at all layers and 2 records are being dealt with
- Both the maintenance and administration backups have been successfully completed and within recommended time frames
